Adding an Item
To add an item to the roadmap, click the "Add New Item" in the Roadmap View.
This will open an window in which you can enter information about the new item.
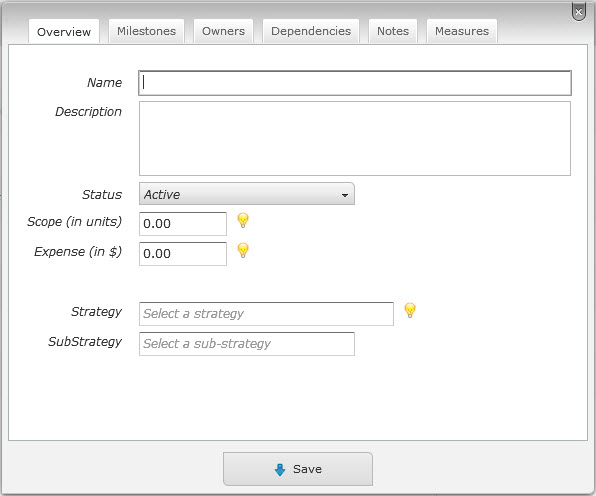
While you can enter a lot of information about an item, only the name is required. However, the more information you enter the richer and more insightful your roadmap will be.
Name and Description
In the Product Overview section, you can enter a name for the product / feature / roadmap as well as a short description.
Status
In the Product Overview section, you can select the current status of the item from the status drop down menu. Over the lifecycle of the item, you will update the status of the item and this status information drives a number of views and insights.
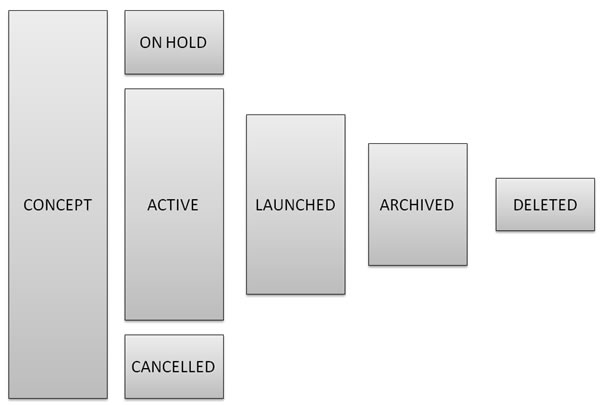
Although you can use an arbitrary interpretation for each status to suits your needs, if you are able to map your products and features to the following model, the views and insights built into the application will be most useful and will make sense immediately.
- Products and features begin as a concept. A concept is essentially a way to classify an item as idea. It typically implies no committment of resources, expenses, or timelines. It's just a way to capture things floating around that might make sense to get on to the roadmap at some point.
- When a concept get some degree of commiment, it becomes active. An active item is something that might have resources, work, or timelines committed to it, or it might just imply organizational committment -- an agreement within your organization that the project should be done and needs to "get in the pipeline."
- During it's lifecycle an item might get put on hold or might get cancelled. It's usually useful to track this state so that you can tell how much of your organization's resource were expended on a dead-ended feature or initiative.
- When a feature or initiative goes live, it can be marked as launched.
- The archived state is a way for you to retian projects on your roadmap without actively considering them in typical views and insights (unless you explicitly choose to.) You may choose to put items in this state to retain the items information for historical information or to keep them around for a reference.
- When an item is marked as deleted, this is a signal to application to permanently delete this item from your roadmap. The deletion of projects typically happens (automatically) when you log out of the application. So, if you mistakenly mark an item as deleted, you can recover it (by changing it's state) unless you've logged out.
Scope and Expenses
The scope of an item is a measure of the effort expended on the item -- typically development time. The units are arbitrary and can represent what's commonly used in your organization such as days, or hours, or some other metric.
You can also capture addtional expenses that the item might have incurred.
Between the explicit expeneses and the scope (which could be converted into a monetary value) you can determine the main costs of a project or feature.
Strategic Alignment
Most organizations pursue multiple strategic objectives in parallel. For instance, your organization might have three or four key priorities. Consequently, you might want to know how your roadmap aligns against these strategic goals.
You can tag each item with two levels of strategic alignment. The auto-complete feature on these fields helps eliminate duplicates and ensures consistency.
One of the key insights in the application -- the Portfolio View -- uses these alignments to show you how your roadmap aligns against key strategies.
Milestones
A product, feature, or project has a number of milestones that you can track. You can chose to track as many or as few as you'd like. These milestones are then reflected in the Calendar view of your roadmap.
The milestones that can be tracked are:
- Launch date
- QA complete date
- Code complete (freeze) date
- Code start date
- Specification (requirements) complete date
While you can enter specific calendar dates for these milestones (or select one from the calendar), one of the key features of the application is it's support for "flexible business dates." Flexible business dates allow you to express dates in common formats (such as 3 Jun 2009) or in an inexact fashion, which is common in business (such as Q1 2009 or Mar 2009.) These dates are interpreted intelligently so that your roadmap insights make sense. For example, while looking at a calendar, items launching in "Q2 2009" will appear on June 30, 2009.
The application understand the following types of date structures:
- 03/07/2009
- 03/07/09
- 3/7/09
- 3/7
- 03/07
- 3 JUL 2009
- 3 JUL 09
- 03 JUL 2009
- 03 JUL 09
- 3 JUL
- 03 JUL
- 3/2007
- 03/2007
- JUL 2007
- JUL 07
- Q2 2007
- 2Q 2007
- Q2 07
- 2Q 07
- 1H 2007
- 1H 07
- H1 2007
- H1 07
Contacts
You can track a number of contacts for each item. These include business, product, engineering, and QA contacts.
Measures
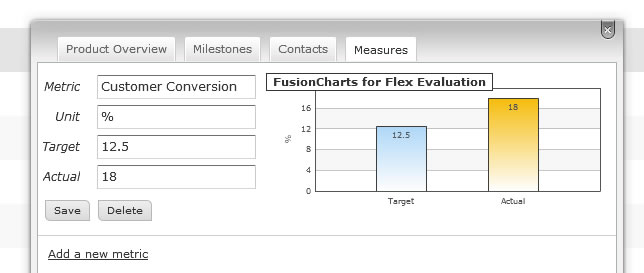
You can add one or measures to an item.
A measure is a way to quantify the expected and actual impact of a product or feature -- a success metric. To define a measure you will need to provide:
- A metric name (e.g., Customers Acquired, Margin Improvement, Money Saved, etc.)
- A unit of measure (e.g., $, %, # of customers, etc.)
- A target value which must be numeric
- An actual value which must be numeric
This is a way to track what the expected and actual benefits of a project are. A graph is automatically created when the information is provided.