
Insights View
The isights view transforms your filtered roadmap into key reports.
Please note that the reports and insights are based on the filtered roadmap (i.e., the items visible in the roadmap view.) If you want your insights to include other items, please fine tune the roadmap view and then view the isights.
Portfolio Insight
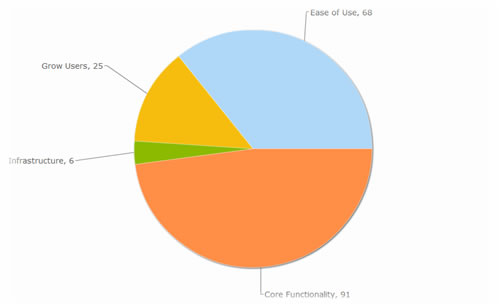
This insight tell you how your product efforts line up against your key strategic priorities. It maps the resources expended for each item (the scope) against the top-level strategic goals defined across various items in the roadmap.
This information is represented in a pie chart, where each slice represents a unique strategic goal. The scopes of multiple items with the same strategic goals are combined into a single slice.
Clicking on any slice will show you the drill down of the items contributing to that stratetic goal on the right.
Pipeline Insight
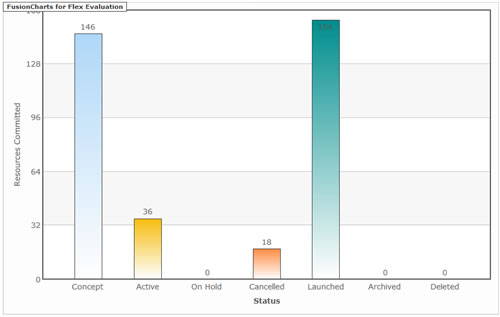
This insight tell you how your product efforts are distributed against various item states. It maps the resources expended for each item (the scope) against the various statuses that an item can be in: concept, active, on hold, cancelled, launched, archived, or deleted.
This information is represented in a bar chart, where each bar represents a unique status. The scopes of multiple items with the same state are combined into a single bar.
This information is typically used to understand how your organization's resources are tracking against various states in the product.)
Clicking on any bar will show you the drill down of the items contributing to that item status on the right.
Grid View
You can view your filtered roadmap in a table format.
You can sort by any column by clicking on the column header.
You can move the order of the columns be selecting a column and dragging to the right or left.
You can also resize column widths.
Exporting
Click on the export button on the top right in the grid view to export your table into CSV format which can then be viewed in Excel.
Printing
While there is no way just yet to directly print the grid from Pypelyne, you can export the table, open in Excel, and print.
You can print the charts directly from Pypelyne. Right click on the chart and select "Print Chart".